🔵🔀 GraphMaker 🔵

![]()

![]()
GraphMaker is a tool for creating, manipulating, and exporting graphs using natural language.
Table of Contents
- Motivation
- Installation
- Getting Started
- Usage
- Tips
- Gallery
- Command Details
- Style Details
- The GraphMaker Node Library
Motivation
Graphs — structures consisting of a set of nodes and a set of edges between some pairs of nodes — are commonly used to depict relationships among entities in many different fields. While there is a variety of good tools for creating pictures of graphs, the practical reality is that making such pictures tends to be a fiddly process that often takes far longer than expected. GraphMaker offers a fluid, natural-language interface for building good pictures of graphs efficiently. You tell GraphMaker what you want added or changed in the graph, and you can see the result at each stage. GraphMaker supports a variety of graph types and a wide range of styling options for nodes, edges, and decorative text and markers. It can output pictures of the graph in a variety of formats (including SVG, PDF, LaTeX/TikZ, and PNG) and can save its internal representation (conforming to a JSON schema) so that the graph can be modified or extended in future sessions. GraphMaker is designed to free the user from fiddling with the specific positions of nodes or edges; it uses automatic positioning coupled with user-specified constraints to achieve a Do-What-I-Mean quality.
GraphMaker provides an interactive text REPL along with a library that can be used to provide the same functionality in other software. It uses an AI model for parsing user tasks and can accommodate a variety of models and providers.
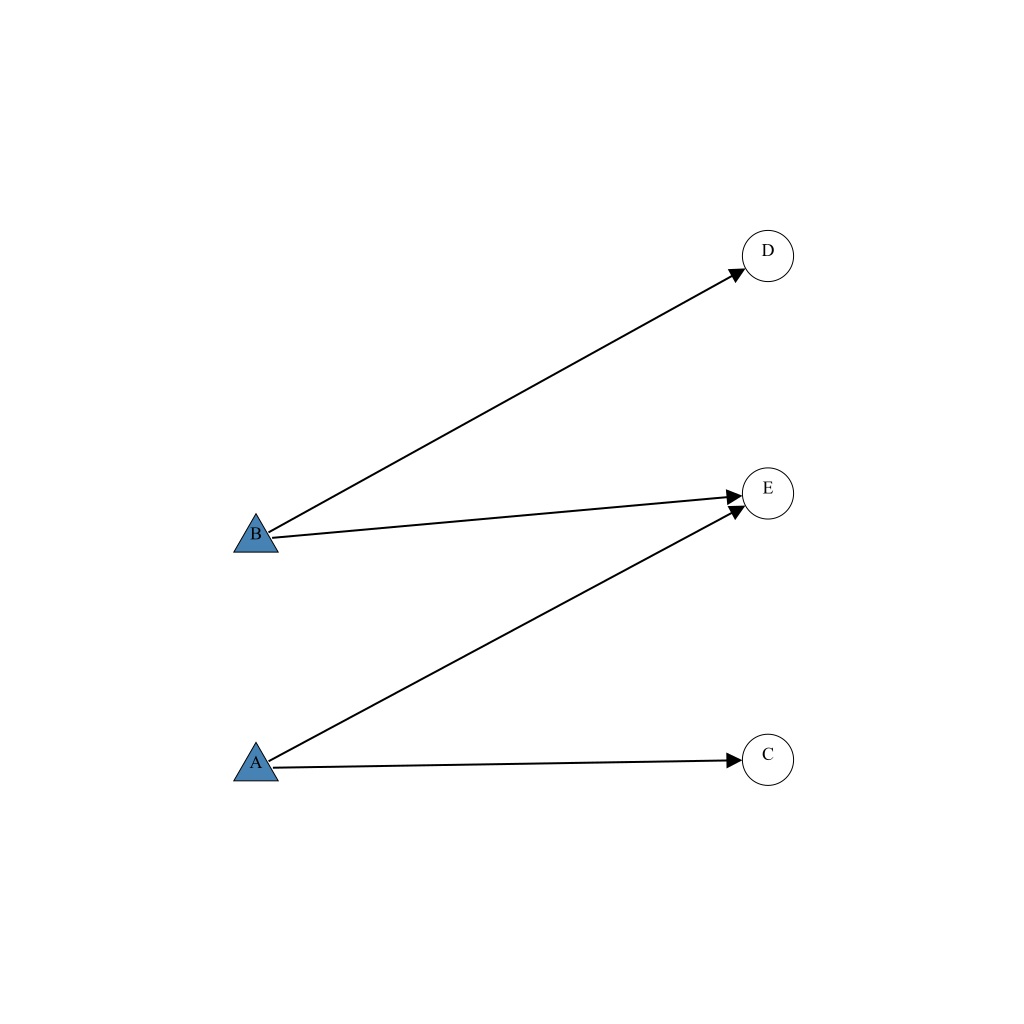
A session might look like
> make the graph directed
As you wish.

> add nodes A-E
Ready for more.

> add edges from node A to C and E
Task complete.

> add edges from node B to D and E
As you wish.

> add constraints that nodes A and B are at the same x coordinate
I've got this.

> add a constraint that C, D, and E are at the same x coordinate
As you wish.

> add a constraint that A is to the left of C
Stick a fork in me, I'm done.

> make nodes A and B triangles with a fill color of steelblue
As you wish.

> set every node's label to its name
Ready for more.
This produces the following graph
Installation
Via installation script:
To install or update graphmaker, you can run the install script. You may either download and run the script manually, or use one of the following commands:
curl -sSL https://raw.githubusercontent.com/isle-project/graphmaker/install-graphmaker.sh | bash
wget -sSL https://raw.githubusercontent.com/isle-project/graphmaker/install-graphmaker.sh | bash
Via npm:
npm install -g @isle-labs/graphmaker
Getting Started
Before you start the REPL, make sure you have your OpenAI API Key ready. You can obtain one here. Then, you may export it as an environment variable:
export OPENAI_API_KEY=<your-api-key>
(e.g., in your .bashrc or .zshrc file).
Start the REPL from the command line with command
graphmaker
Alternatively, you may pass your API key as an argument to the REPL command:
graphmaker --apiKey <your-api-key>
Last but not least, you can set your API key in the REPL itself:
:config OpenAI.apiKey <your-api-key>
You are now ready to start using GraphMaker to create graphs with natural language commands thanks to the power of AI!
You will see a simple prompt '> ' at which you can enter a task for GraphMaker to adjust the current graph or a command that performs a higher-level operation.
Tasks are natural language descriptions of a change or addition to the current graph.
GraphMaker maintains the state of the current graph (along with this history of all previous states),
and each task modifies the graph to produce a new graph.
At start up, we begin with an undirected graph with no nodes, edges, or decorations.
A task is a sentence that tells GraphMaker how to adjust the current graph:
add three nodes, make the graph directed, add an edge from node A to node B,
and so forth.
All entities (nodes, edges, decorations) have names by which you can refer to them,
names which are distinct from any labels you assign the entities. The names do not
appear in a :save'd picture but are visible when you :show a picture.
By default, nodes are given alphabetic names in the order they are introduced.
See Labels and Names below for more detail.
While the models can parse quite complex sentences, it is usually a good idea
to keep your meaning and references as clear as possible.
Commands start with ':', the basic ones are
:help, :intro, :tips, :examples,
:exit, :show, :save, :load,
:reset, :undo, and :redo.
To see the full list of commands, you can use :help from
within the REPL or use the --help flag on the command line:
graphmaker --help
Usage: graphmaker [options]

Options:

  -w, --width PIXELS                Width of image canvas in pixels

  -h, --height PIXELS               Height of image canvas in pixels

  -d, --draft                       Display extra information, e.g., node reference na
                                    mes

  -f, --format FORMAT               Default output format for :show/:save commands

  --autoshow FORMAT-OR-FALSE        If not false, automatically display graph after ea
                                    ch command with this format (default: svg)

  -o, --orientation ORIENTATION     Default orientation for displaying the graph indic
                                    ating where the first/root node is positioned (eit
                                    her 'left', 'right', 'top', 'bottom', or 'auto')

  -c, --config FILE_PATH            Path to JSON configuration file (Default: ~/.graph
                                    maker.json)

  -p, --provider NAME               Model provider ('OpenAI')

  -m, --model NAME                  Model to use ('gpt-4o-mini')

  -a, --apiKey ARG                  Model provider API key

  -t, --type NAME                   Model type ('streaming' or 'single')

  --exec ARG                        Determines how tasks are sent to the AI model in t
                                    he :exec command: 'batch' [fewest requests], 'incr
                                    emental' [one request per task], and 'auto' [model
                                    -dependent]

  -v, --version                     Print package version number and exit

  -h, --help                        Print this message and exit
The full set of commands is described in detail in the REPL Capabilities section.
Example Session 1
In this session, we build a simple, undirected graph with some basic styling and labels. GraphMaker's responses have been omitted for clarity.
> add seven nodes
> add a style "left" to nodes A, B, C
> add a style "right" to nodes D, E, F, G
> define the style left to have node shape square, fill color blue, and line width thick
> define the style right to have node shape triangle, fill color tomato, and fill style hashed vertical
> add constraints that make all nodes with the same style tag have the same horizontal coordinate
> add a constraint that node A is to the left of node D
> add edges from A to D, F, and G
> add edges from B to E and F
> add edges from C to E and G
Example Session 2
In this session, we build a finite automaton, where states are represented by nodes and transitions by edges labeled with the input. GraphMaker's responses have been omitted for clarity.
> make the graph directed
> add nodes A-G
> add constraints that each of nodes A-E is to the left of its successor and has the same y-coordinate
> add a constraint that node F is above node A and has x-coordinate centered on those of nodes A-E
> add a constraint that node G is below node A and has x-coordinate centered on those of nodes A-E
> set the fill color for node E to green
> set the fill color for node F to red and the fill style to crosshatched
> set the label for node A to be "Start"
> add an edge from A to B with label "0" and with angle leaving and entering -45
> add an edge from A to G with label "1"
> add an edge from G to itself with label 1 and loop direction -90
> add an edge from G to E with label "0"
> add an edge from B to C with label "0" and edge from B to F with label "1"
> add an edge from C to D with label "0" and edge from C to itself with label "1" and loop direction -90
> add an edge from D to E with label "0" and an edge from D to F with label "1"
> :save ./automaton.svg
At each stage, you can see the graph being built and then can save it in a variety of formats. Adding the edges one at a time might be tiresome in a large graph, so we can specify them all at once. Here is an alternative version of the previous session that is more compact:
> make the graph directed
> add seven nodes
> add constraints that each of nodes A-E is to the left of its successor and has the same y-coordinate
> add constraints that nodes F and G have x-coordinates centered on those of nodes A-E
> add constraints that F is above node A and that G is below node A
> set the fill color for node E to green and for node F to red and give F a fill style of crosshatched
> set the label for node A to be "Start"
> :multiline
Add edges for the following adjacency matrix, ordered A-G
  0, 1, 0, 0, 0, 0, 1
  0, 0, 1, 0, 0, 1, 0
  0, 0, 1, 1, 0, 0, 0
  0, 0, 0, 0, 1, 1, 0
  0, 0, 0, 0, 1, 0, 1
^D
> :multiline
Add labels to the edges as follows
  A to B "0", A to G "1"
  B to C "0", B to F "1"
  C to D "0", C to C "1"
  D to E "0", D to F "1"
  G to E "0", G to G "1"
^D
> set the loop direction to -90 for the self loops at nodes C and G
> set the angle leaving and entering to -45 for the edges with source A
> :save ./automaton2.svg
Here, the "^D" represents a Control-D character that is used to end the multi-line input.
Usage
Conventions
GraphMaker tracks three kinds of entities: nodes, edges, and decorations. Nodes and edges are components of the graph, as expected. Decorations represent either arbitrary text strings or rectangular regions that are used to demarcate and label parts of the graph. Every entity has a name that is used to refer to it when building the graph. This name appears on the draft pictures of the graph but not in the saved production picture. By default, nodes are given alphabetic names (like A, B, C) and edges are named like AB or AC for the nodes they connect, but you can specify the names as you prefer. The next section discusses this in detail.
Every node, edge, and decoration has several properties that can be set by the user. For instances, nodes and edges have an optional label; edges have an optional numeric weight; and both can have associated data as key-value pairs. Edges specify a source node and a target node; the distinction is only visible if the edge is directed, but it is maintained in the names and underlying data.
GraphMaker keeps track of the current graph being bulid and the
entire history of changes you make to the graph from the beginning
of the session. You can move through that history, reset the graph
to its initial state, or load a saved graph from a file. When you
enter a task into GraphMaker, you are describing a change to the
current graph. You can view that graph at anytime with the :show
command.
Labels and Names
GraphMaker assigns a name to every node, edge, and decoration. These names allow the user to refer to the entity in a task and are distinct from the labels that one might add to the picture. Each name must be unique within the graph. However, the user need not think of names for everything; by default, GraphMaker will assign simple and memorable names to nodes and edges as they are added to the graph. Default names for nodes are alphabetic labels A, B, C, ...; and default names for edges are strings like AB, CD, XY comprised of the names of the nodes being connected (in order from source to target in the directed case). If you prefer different names, you can indicate that to GraphMaker when you construct the entity. For example:
> add nodes "Parent", "Child 1", "Child 2", and "Child 3"
> add an edge "Oldest" from Parent to Child 1
> add an edge "Youngest" from Parent to Child 3
> add a text decoration Title with text "Family Tree" centered just below the top of the canvas
Names are only shown on the graph in draft mode during the REPL session
(displayed in a shaded gray color)
and will not be included in the saved output.
(By default, the :show command produces pictures in draft mode, though this can be changed
with the :config command. Output produced by the :save command has draft mode off.)
In contrast to names, labels are arbitrary strings attached to nodes and edges to be displayed in the graph output. Labels can be styled in various fonts, sizes, colors, weights, and styles; they can also include mathematical text in LaTeX. Labels can be set when a node is added
> add nodes A, B, and C with labels "Start", "Middle", and "End"
or at any point afterwards
> set the label of node Z to "Accept"
Labels can include any text, including spaces and unicode characters. You can also instruct Graphmaker to treat the label as a mathematical equation, in either LaTeX or MathLingo format. To do this, you specify the type of label and give the value; no delimiters ($, $, ∖(, ∖[) should be included. For example:
> add a node with LaTeX label of \chi^2(\alpha)
> add a node with mathlingo label e to the minus x squared over two
You can also set the label of an edge:
> add an edge from A to B with label "Shortcut"
The label text can be styled with a variety of parameters.
> add a node A with label "Pass Go"
> set the font size for A's label to 20, its weight to bold, and its color to tomato
See Style Details for more on the style parameters supported for text. These parameters can also be set in defined styles that can be applied to any entity:
> define a style salient with font size 20, font color tomato, and font weight bold
> add the style salient to node A and edge AB
Graph Types
Graphmaker has explicit support for several graph types.
You can tell it explicitly to make a graph undirected (no arrows on edges) or directed (arrows on edges). By default, graphs are initialized as undirected.
> make this graph directed
(Note that individual edges can be made undirected, directed, or bidirected, regardless of the graph's specified type. The graphs type becomes the default for an edge.)
Graphmaker specially handles trees and Directed Acyclic Graphs (DAGs), which are typically displayed in a form consistent with their structure. To create a tree or DAG, you need to specify a parent relation between nodes:
> node A is a parent of node B
This implies that there is an edge from A to B and that A is a predecessor of B. When there are parent relations in the graph, GraphMaker checks if the graph constitutes a tree or DAG. If the resulting graph (excluding self-loops) forms a tree, GraphMaker will format the graph accordingly. Otherwise, if there are parent relations and no cycles, it will format the graph as a DAG.
Both trees and DAGs have a default layout orientation. The orientation config option
sets this. By default, it is auto which causes trees to be displayed from the top
down, with the root at the top and DAGs to be displayed left-to-right with the
earliest nodes (with no predecessors) at the left. The orientation option can be
set to top (top down), bottom (bottom up), left (left-to-right), or right (right-to-left)
as desired. For general graphs, this option is used only in the initial positioning of the
nodes in the order defined.
GraphMaker is not limited to simple graphs. You can define multiple edges between two nodes, which will have distinct names and properties. You can also define edges from a node to itself (self-loops). When defining multiple edges between nodes, it is helpful to indicate that this edge should be distinct. For example:
> add an edge from A to B
> add another distinct edge from A to B
> add three distinct edges from C to itself
Graphmaker can also support other specialized graph forms, such as bipartite and complete graphs. To generate a complete graph, try
> give me a complete graph on six nodes
You can also be more direct to the same effect:
> add six nodes
> add an edge between each distinct pair of nodes
For bipartite graphs, it is often most effective to set style tags on the nodes to determine their class
> add nodes A-G
> add a style tag 'bluebird' to nodes A-D
> add a style tag 'chickadee' to nodes E-G
> define the style 'bluebird' to have square shape and fill color blue
> define the style 'chickadee' to have fill color brown
> add constraints that make all nodes with the same style tag have the same horizontal coordinate
> add edges from A to F and G and from B to E and from C to E, F, and G
Node Properties
To create our graph, one will often start by creating nodes. Each node has a name, an optional label, several ways to specify how that node is styled, and several properties that can be customized. The supported properties are:
-
Node Shape
Graphmaker supports various shapes for nodes:
circle(default),ellipse,rectangle,square,diamond,triangle, andinvisible. (Of course, circles are ellipses and squares are rectangles, but all of them are valid.) Aninvisiblenode displays no shape, but its labels (and names in draft mode) are displayed.You can change the shape of a node by telling GraphMaker directly
> make node A a triangle
> make nodes B, C, and D a diamond
You can also create a node with a shape from the outset
> add a diamond nodeNode shapes can also be set more generally using
styletags anddataattributes as described below. This can be more efficient when there are multiple nodes whose shape needs to be set or changed. -
Node Width To Height
This is a positive number that specifies the aspect ratio of the node's shape (more precisely, the shape's bounding box). The default value is 1.
-
Node Size
This is a scaling factor that determines a node's size relative to the default (with value 1). Note that in the pictures that are produced, the base node size on the canvas depends weakly on the number of nodes in the graph.
-
Label Offset
The label offset determines where a node's label (if any) is displayed relative to the center of the node. For nodes, offset distances are in units of the node's size (exactly analogous to the Node Size parameter).
The offset can be specified in various forms
-
none: the label will be anchored at the center of the node. This is the default. -
A cardinal direction (
north,northeast,east,southeast,south,southwest,west,northwest): the label will be offset by one unit from the center of the node in the specified direction. -
A cardinal direction with a distance: the label will be offset from the center of the node by the given distance (in units of node size) in the given direction. For example,
> set the label offset for A to northeast by 1.5will anchor A's label to the top right of the node by one and a half node radii.
-
Two numbers
dx, dyrepresenting offsets in units of node size in the direction (dx, dy). For example> set the label offset for A to 1, -1will anchor the label at the bottom right corner of a box surrounding the node.
-
-
Node Style
We can associate one or more style tags with a node. A style tag is just an arbitrary name that will be (separately) associated with a set of styling parameter settings.
We can change or set the style tags associated with the node by telling GraphMaker to add that name as an associated style:
> add a style 'leaf' to nodes A, D, and F
> add a style 'branch' to nodes B, C, E, and G
At this point,
leafandbranchare just tags, but they are assigned meaning by defining a style with that name. A style is an assignment of one or more styling parameters and can also include node and edge properties> define the style 'leaf' to have fill color gray and node shape square > define the style 'branch' to have line color steel blue and node shape ellipse with width twice the heightNow we can reconfigure the style for multiple nodes in one step.
> change the node shape in the style 'leaf' to be ellipseA node may have more than one style tag. All of them apply, and styles later in the list take precedence.
> define the style 'special' to have fill color green
> add the style 'special' to node A
Now node A will be a green square.
-
Data Attributes
One can associate with a node a set of arbitrary data, specified as key-value pairs. These data can be used in GraphMaker both to /select/ nodes in a task and also to set values and styles.
> add nodes A-D
> for A and C add data role 'admin'
> for B and D add data role 'user'
> add an edge from each node with admin role to each node with user role
> add constraints that make all nodes with the same role data have the same vertical coordinate
> add a constraint that A is below B
In addition, one can set any individual styling parameters for the node, such as fill style or line color. Any individual style parameter set for the node overrides the effect of a style tag. For example:
> add nodes A-C
> add a style 'foo' to nodes A and C
> define the style 'foo' to have fill color blue and fill style of vertical hashing
> set the fill color for node A to be 'tomato'
Now A and C both inherit the style 'foo' but A's fill color has been changed.
As mentioned earlier, more than one style can be added to a node
> append a second style 'bar' to node A
> define the style 'bar' to have line color red and line width thick
See the section Style Details for details on the supported styling parameters and their values.
Edge Properties
Edges in the graph are the connections between nodes. Each edge has a source and target, specified implicitly when defining the edge. You can create an edge between nodes A and B simply by saying something like
> create an undirected edge between A and B
or
> create a directed edge from A to B
By default, edges in a graph are undirected. To make all edges directed, you can say
> make this graph directed
It is also possible to create an edge from a node to itself (a self-loop) by saying something like
> add an edge from A to itself
As with nodes, edges have an optional label that can be set in the same way (including LaTeX and mathlingo formats). Also as with nodes, edges can have zero or more style tags, and you can set individual styling parameters for a particular edge, which will override the values of parameters set in a style. (Again, see the section Style Details for help on those parameters.)
You can use the (implicitly defined) source and target properties of edges to select edges during tasks.
> set the line width to thick for all edges whose source is node A
> set the line color to blue and line style dotted for all edges whose target is node C
In addition, edges have several specialized properties of an edge that can be set to customize its appearance and behavior in the graph.
-
Label Offset
The label offset determines where a edge's label (if any) is displayed relative to the center of the edge. For edges, offset distances are in units of the edge's size, with -1 corresponding to the source end and 1 corresponding to the target end.
The offset can be specified in various forms
-
none: the label will be anchored at the center of the edge. This is the default. -
An relative cardinal direction (
north,northeast,east,southeast,south,southwest,west,northwest): the label will be offset by one unit from the center of the edge in the specified direction relative to the edge's direction (i.e., the line between source and target translated to the edge center). -
An absolute cardinal direction (
up,up right,right,down right,down,down left,left,up left): the label will be offset by one unit in the specified direction (relative to the canvas) from the center of the edge. -
A cardinal direction (relative or absolute) with a distance: the label will be offset from the by the given distance (in units of edge size) in the given direction. For example,
> set the label offset for AB to northeast by 1.5 > set the label offset for BC to down right by 1.5 -
Two numbers
dx, dyrepresenting offsets in units of edge size in the direction (dx, dy) relative to the edge direction. For example,> set the label offset for AB to 0.75, 0.05will anchor the label three quarters of the way from the center to the target end and slightly above.
-
-
Weight
An optional numeric value associated with the edge. It is often used to represent the strength or cost of the connection between two nodes. The weight of an edge is displayed as a separate label on the edge. The weight of an edge can be set when the edge is created or later. For example:
> create an edge from A to B with weight 3> set the weight of the edge AB to 11 -
Weight Offset
Weight offset is handled and specified exactly the same way that label offset is, except that the weight is displayed on the other side of the edge (e.g., bottom vs. top) as the label.
-
Loop Direction
For self loops, you may explicitly specify a loop direction, which defines the angle at which a self-loop edge points to the node. The loop direction is defined as a numeric value giving the counter-clockwise angle from the positive x-direction. For example:
> create a directed edge from A to itself with loop direction 45The loop direction can also be set later:
> set the loop direction of the edge AA to 45 -
Angle Leaving and Angle Entering
By default, an edge between two nodes is displayed as a line (maybe with arrows) from source to target. But sometimes it is desirable for the edges to be curved. The angle leaving and angle entering parameters determine the angle (relative to a straight line) at which the edge leaves the source and enters the target respectively. When these values are non-zero, the edge is displayed as a cubic Bezier curve; the angles are 0 by default, giving linear edges. The values are used so that the same sign leaving and entering indicates a curve toward the same side of a linear edge. For example,
> set the angle leaving and entering to 45gives an edge that arcs to the left of the line between source and target, with a 45 degree angle between the curve at beginning and end and that line.
-
Softness Leaving and Softness Entering
The softness parameters can be used to adjust the curvature of a curved edge near the source (softness leaving) and the target (softness entering). The softness is a non-negative number with a default of 0.5; typical values are between 0 and 1, with 1 having more pronounced curvature.
-
Decorations
Decorations are graphical elements in saved picture that are not part of the graph. Graphmaker supports three kinds of decorations:
-
Text
Text decorations specify strings or paragraphs that are added to the picture at designated locations. A text decoration can be configured with any styling parameters that affect text (e.g., font color, font size, font style, font weight, font variant). It also accepts two specialized properties that affect how the text is displayed:
-
Text Anchor (values:
start,middle,end,top,bottom; default:middle)This indicates the point in the string of text is at the specified position of the decoration. For multi-line text, an additional
toporbottomcan be supplied to specify the vertical component of the anchor. Thus,start topanchors in the top-left corner of a paragraph;middle topin the middle of the top line. Atoporbottomhave no effect on single lined text. -
Text Justify (values:
left,right,center,none,list; default:none)This indicates how a multi-lined text paragraph is justified. The value
listputs each line on its own like a bulleted list with no bullets.
The position of a text decoration can be specified in two ways. The first of these is more more flexible and useful.
-
Alignment Constraints
You can specify optional expressions (as with node position constraints) for the x (horizontal) and y (vertical) coordinates of the text anchor relative to nodes or edges in the graph. These are often given explicitly. For example:
> add a text decoration "tip" with text "This is where we start"
> align the decoration "tip" at the midpoint of nodes A and B
You can give different conditions on the x and y coordinates of the anchor in this way. You can align relative to the center of the nodes or to the north, north east, east, ..., north west corners of the bounding boxes of those nodes. For example:
> align the x coordinate of decoration "warning" to the north east of node A > align the y coordinate of decoration "warning" to the south of node B > align the decoration "big warning" at the average coordinates of nodes D, E, and F -
Absolute Position
You can specify x, y coordinates for the text anchor, where x (horizontal) and y (vertical) positions are both between 0 and 1. So, 0, 0 is the bottom left corner of the canvas; and 1,1 is the top right corner of the canvas.
As the name suggests, absolutely positioned text will not move if the graph is repositioned.
-
-
Regions
Region decorations depict rectangular areas on the canvas and are typically used to demarcate or otherwise highlight particular parts of the graph. For example, in graphical models plates are rectangles around one or more nodes indicating a repeated substructure.
As with nodes and edges, each region is given a name so the user can refer to it when giving tasks. The name does not appear in the output. If no name is specified, it will set automatically (typically to
region1,region2, ...). You can see the details on all defined regions with the:show decorationscommand at the REPL prompt.Adding a region decoration requires specifying a width and hight and an x, y position. As with text, the coordinates can each be specified in two ways:
-
Alignment Constraints
A region decoration can be set to align with or to contain specified nodes. For example:
add a region decoration "plate" that contains nodes A and B add a region decoration "blurb" align the x-coordinates of blurb's northwest corner and node C align blurb's northwest corner three node sizes below node C give blurb a width and height of 0.25 -
Absolute Coordinates We can specify a regions x and y coordinates with (0,0) being the lower left corner of the canvas and (1, 1) being the upper right corner.
In addition to the coordinates, we can specify the region's width and height on a scale from 0 to 1 (canvas width or height, respectively). A constraint that a region contains one or more nodes will override this width; more specifically, the region will be as close as possible to the stated width and height consistent with any containment constraints.
Finally, you can specify styling parameters for regions, including defined styles fillColor, fillStyle, lineColor, lineWidth, and lineStyle.
-
-
Arrows
Arrow decorations add arrows to the picture that are not edges in the graph. By default, the arrows are styled to look different than edges, and those styles can be configured. To specify an arrow decoration, you need to give
- Positions of the start and end. As with texts and regions, these positions can be specified absolutely or through alignment constraints (or a mixture).
- Arrowhead styles for the start and end. By default, an arrow decoration has an arrowhead on the end and none on the start, but this can be modified to any of the four possibilities. Arrow styles are listed in the styling details. (ATTN: For the moment, only one arrowhead style is supported.)
- Optional styling parameters, including defined styles, lineWidth, lineColor, and lineStyle.
Styling
Graphmaker supports a variety of styling parameters for nodes, edges, and decorations. See Style Details for details on these parameters.
In addition, you can define named styles, which are tags that have associated settings of one or more styling parameters. You can then apply zero or more named styles to any entity, effectively setting its styling parameters. The advantage of named styles is that they help apply a consistent look to multiple entities at once and can easily be changed as desired. If more than one named style defines the same styling parameter, the style first specified in the style list takes precedence.
Individual style parameters set on an entity take precedence over any settings in a named style applied to that entity. In this way, you can make large scale styling decisions and adjust or specialize the styling for particular needs.
Graphmaker attempts to make the settings of style parameters as consistent as possible across output formats, but there may be slight variations across formats.
Constraints
Graphmaker's philosophy is to make it easy to incrementally build up a graph and save it in multiple formats, with an option of continuing later to modify or adjust it. It tries to do what you mean with a minimum of specification, but this may require some fine tuning to get exactly the shape you want. The use of AI model, while powerful and flexible, adds some inevitable variation to the result that may also require adjustment.
An effective practice is to add your nodes and edges as desired and then add constraints on the nodes (and decorations). Node constraints can specify linear relationships among node positions (relative to specified anchors). The AI model can translate natural language for constraints into reasonably accurate forms, making the constraints relatively easy to specify. For example,
Add constraints that puts node C at the average position of all other nodes
will generate two constraints, one on the x-coordinate of node C and one on its y-coordinate.
Similar constraints, like Add a constraint that C is at the midpoint of A and B or
Add a constraint that C is above B, or Add a constraint that A and B are at the same horizontal coordinate
express the relationships in simple and intuitive terms.
Note that we often start constraint tasks with Add constraints that or Add a constraint that.
While not strictly necessary, this helps the model interpret the task correctly.
By default, constraints on the node position will use the node's center point as the relevant anchor. However, you can specify instead a point on the boundary of the node's bounding box by giving a cardinal direction (north, north east, east, south east, south, south west, west, north west):
add a constraint that the x coordinate of C at the north west equals that of B at the south east
will horizontally align the upper left of C with the lower right of B. You can also use "center" as an explicit anchor if you need to specify precisely or change from a different value.
Constraints can be specified as equalities or inequalities. For instance, a constraint that A is below B
indicates that A's y-coordinate is less than or equal to B's y-coordinate. Inequality constraints can go
in either direction (greater or less).
When working with constraints at the REPL, the :reposition command can be useful. Graphmaker solves for
a good arrangement of your nodes and edges, adjusting incrementally as new structure is added to the graph.
So that the graph remains stable as you proceed, Graphmaker uses the previous positions as starting points
for repositioning nodes after adjustment. Sometimes, however, you have made sufficient changes that you
do not want to be bound by the earlier positions. The :reposition command clears saved positions and
gives a fresh solution. Adding constraints can sometimes be more effective after this command.
In addition to node position constraints, you can also put some mild constraints on decorations. These are applied after the nodes are positioned, not concurrently. You can specify that a decoration be aligned with a node (relative to anchors for each) or that a region decoration should contain one or more particular nodes.
Finally, if you specify parent-child relationships between nodes (which imply an edge), then Graphmaker will use that information to adjust the graph layout accordingly. For instance, parent relations are used to detect if the graph is a tree, or forest of trees, or directed acyclic graph, yielding a more approriate layout.
Graph Output
Graphmaker supports multiple output formats: SVG, LaTeX/TeX, PDF, PNG, JPG, GIF, TIFF, WEBP,
and JSON. The LaTeX/TikZ format produces a complete LaTeX file that can be processed to
show the picture. The picture is in an isolated tikzpicture environment and can thus
be extracted into any other LaTeX file. (Note that a few package/library inclusions are
required as indicated in the output file.) The JSON format is a data-representation of the
graph that Graphmaker stores to record the state of the current graph. The saved JSON
output can be loaded into Graphmaker to continue or modify the existing graph.
At the REPL, the default format can be determined and changed using the :config command
(with key format). The default default format is SVG. These files can be opened and viewed
in any modern browser.
The :save command is used to save the current picture to a file in a specified format.
This can be run any number of times with different formats. The :show command shows
you the current graph in a way based on the format given. (For example, :showing an
SVG file will cause the picture to be displayed in a browswer automatically.) Both
JSON and TeX/LaTeX/TikZ formats are text-based and will be displayed to the terminal
on a :show command. Note that the :show command might display slightly less information
than is saved to make the output more readable. See the next subsection for further details.
REPL Capabilities
The Graphmaker REPL provides an environment for interactively building your graph and saving pictures in various formats. The REPL has a built-in help system, a complete command history, command and file completion (with TAB), and a variety of commands to improve the experience.
Help
There are several ways to get help from within the REPL: the :help, :examples, :intro, and :tips commands.
The :intro and :tips commands provide some tutorial documentation. The :examples command let's you interactively
view the tasks and output from a gallery of examples.
The :help command answers free-form questions about the system, parameters, and commands. For example:
> :help how does the :help command work
The `:help` command is used to get information about the available commands, parameters, and functionalities. When the `:help` command is used, the system will provide a response containing a description of the command or parameter and how it can be used. This helps users understand how to interact with the system and make use of its features effectively. The response will be in the form of a text description and may also include examples or additional details to provide further clarification.
A bit chatty, but often useful. This is especially useful for finding details about the styling parameters, which can be hard to remember.
> :help what are valid values for the line width
Valid values for the line width can be one of the following: "very-thin", "thin", "medium", "thick", or "very-thick".
If given without any text, :help will give a summary of available commands. If given a single word, it will
use that as a topic to look up relevant documentation on that word.
History
You can scroll through your command/task history from the REPL, extending across the current session and earlier sessions. Use Up-arrow or Control-p to move to earlier commands; and Down arrow or Control-n to move to later commands. You can edit the visible command and hit enter to submit your edited text.
The history is stored in the file .graphmaker_history in the user's home directory.
The :history command will display the history; if given an integer argument n, it will
show the most recent n history items.
The :transcript command will save all the commands and tasks from the current session to a specified file.
You can edit it or :exec it to reproduce your session.
The :undo and :redo move through your history, changing the current graph to past and future states.
If after undo-ing you make changes, then the future history is eliminated.
Tab Completion
When you hit TAB, the REPL will attempt to complete the current command name, file name, or other command argument. Hit TAB once to complete as far as possible. If there is ambiguity, only a partial command will be shown; then hit TAB again to see a list of possible matches.
Notable Configuration Settings
The :config command let's you examine and set a variety of pre-specified configuration parameters that
determine how Graphmaker works. See the help for :config for all the details. Here, we highlight a few
that are use and possible to overlook.
The autoshow configuration parameter can be used to display the current graph after each task.
By default, the autoshow parameter is set to deduce what summary to display from the most recent task.
It can be set to show particular aspect of the graph (graph, nodes, edges, decorations, constraints, data)
that will produce a text summary of that aspect. Or it can be set to an output format (svg, png, jpg, jpeg, pdf,
json, tex, latex) in which case a picture of the graph will be produced as by the `:show`` command.
The format configuration parameter determines the default output format if not supplied to :show.
The orientation configuration parameter determines the default display orientation for graphs (especially trees, forests, and
DAGS). It can be set to left, right, top, bottom, or auto, with the latter attempting to deduce the best orientation
from the graph structure (e.g., top for trees with root on top; left for DAGS with initial node on left).
You can also set the width and height of the display canvas
Finally, the AI model provider configuration is a name that references a configuration parameter with special structure
that is associated with the currently active AI model. For example, if there is an openai configuration parameter, it will
be a structure recording the api key, the specific model, and various provider-specific parameters. When provider
is set to openai, those parameters will be in effect. You can change the provider and you can change the parameters
for a specific provider independently. For example, to change your api key for openai, you would use the command :config openai.apiKey NEW-KEY-HERE.
You can do this for any provider even if it is not active. Use :config provider NEW-PROVIDER to change the currently active provider.
Convenience Commands
The :show command has several related uses. When given a graph format (or no arguments in which case the default format is used),
this command displays the current graph -- in draft mode -- to the user. The medium of display depends on the format.
For example, SVG format is displayed in a new tab in your default browser; PDF format opens a pdf viewer; image formats
like PNG or GIF open an image viewer with the picture, and latex and json formats are displayed to the terminal as text.
In addition, you can use the :show command to display various summaries of the graph in textual form at the REPL.
The :exec and :exec-batch commands will load and run a file containing commands or tasks. The former
executes each command/task one at a time; the latter executes them all at once. Both commands accept some
prefix and suffix text which is wrapped around the contents of the file.
You can for instance :exec the file saved by the :transcript command.
The :load command lets you read a saved graph from its .json file. This overwrites the current graph and resets
the chat history (though not the command history). The :reset command does the same reset, starting with a fresh graph.
The :reposition command forgets saved positions of the nodes, which can be useful for improving layout after many small changes.
Tips
-
Sometimes, the model will get confused by your request. If the task fails for some reason, try to rephrase it, being as specific as you can. Often in this case, it is sufficient to simply repeat the task.
-
When possible, keep each task focused on a particular change. The model can get confused about referents (and who wouldn't?) in long sentences changing many different aspects of the graph.
-
When you want to change a particular feature, it can be helpful to name it. For example, to add a constraint, though it is not always necessary to say the word 'constraint', it is often helpful. So start with 'add a constraint that...' or 'add constraints so...'. The node names are usually sufficient without saying 'node A', but when in doubt adding 'edge', 'node', 'decoration', and so forth will be more robust.
-
Rarely, the model will forget some part of the graph you had set earlier. If it looks like something is missing, you can use the
:transcriptcommand at that point to save a record of your session and then:undoto move back to the most recent good state. -
The
autoshowconfiguration parameter is useful for letting you inspect the changes to your graph and catching if the model does something unexpected. By default,autoshowwill print a (hopefully) relevant summary that connects to your most recent task. Another useful setting is your preferred output format, letting you see the graph at each step.
Gallery
View the gallery for a collection of graphs that were created with GraphMaker. For each graph, you will find its SVG, the underlying JSON representation, and the natural language commands used to generate the graph. The gallery is a great place to learn about the various types of graphs that can be created with GraphMaker and to get inspiration for your own graphs.
Command Details
-
:config [<option> [<value>]]
Set a configuration option for the graph or print its value
-
:examples
Start an interactive exploration of example prompts and graphs. These can be run or modified in the repl itself.
-
:exec [prefix=''] [suffix=''] <filename>
Load a file containing commands and tasks, executing the tasks one at a time. The optional
prefixandsuffixarguments are, respectively, prepended and appended to the file contents. -
:exec-batch [prefix=''] [suffix=''] <filename>
Load a file containing commands and tasks, executing all the tasks in one request to the AI model. The optional
prefixandsuffixarguments are, respectively, prepended and appended to the file contents. -
:exit
Exit the repl
-
:help
With no arguments, show a summary of available commands. With a one word argument, provide help as relevant to that topic as possible. With a many word argument, treat the argument as a request for help and let the model answer. For example, 'What is a valid fill style?' or 'What node shapes are available?'.
-
:history [<n>]
Show the last n commands
-
:intro
Give descriptive introduction to how GraphMaker is used
-
:load <filename>.json
Load a saved graph as the current state. This resets the chat history so the model 'starts fresh'.
-
:multiline
Engage multi-line mode for the next task. Use Ctrl-D to finish the multi-line command, or Ctrl-C to cancel.
-
:redo
Redo the last command
-
:reposition
Reposition the nodes in the graph
-
:reset
Reset the graph to the initial state
-
:save <filename>
Save the current graph to a file
-
:show [<format>]
Show the graph in a given output format (e.g., svg or png in a browser or image viewer) or a summary of the graph in text at the repl. With no arguments, use the default format in the
:config. Valid formats include svg, tex (LaTex via tikZ), gif, tiff, webp, pdf, png, jp(e)g, json; with json, tex, and latex showing as text at the repl. Valid summaries include graph, nodes, edges, decorations, constraints, and data, focusing on the graph as a whole or particular features, respectively. Thedatasummary lists any key-value pairs that have been associated with nodes or edges. See also theautoshowconfiguration parameter. -
:tips
Print tips on how to phrase your tasks
-
:transcript <filename>
Save a record of the current session to a file. This file can be exec'd.
-
:undo
Undo the last command
Style Details
-
arrowStyle Determines the type of arrowhead used for edges with arrows. If not specified, the arrow style is
normal(currently all the styles look the same).Possible values:
light,normal,heavy,double -
fillColor A HEX color or RGB color such as rgb(255,255,255) to fill a shape
-
fillStyle Fill pattern of a shape
Possible values can be one of:
-
solid, which is the default. -
dottedalong with an optional size of the dots and an optional tile size (pixels per dot in all directions) -
hashed, along with an optional hashing direction (one ofvertical,horizontal,increasing,decreasing, default isincreasing) and an optional hash thickness (default: 0.5). -
crosshatched, along with an optional hashing direction (verticalordiagonal) and thickness (default: 0.5)
-
-
fontColor A HEX color or RGB color such as rgb(255,255,255) for the font. rgb(red, green, blue) has each color specified on a range from 0-255.
-
fontFamily Font family
Possible values: Times New Roman, Comic Sans MS, Courier New, Gill Sans, Trebuchet MS, or any font name available on the user's system.
-
fontSize Font size in points
Default value:
12 -
fontStyle The font style property controls whether the text is rendered in a
normal,italicorobliquestyle. Oblique text is a less common style, where the text is slightly skewed in the horizontal direction, without altering the shape of the characters. Italic text is a style of text based on calligraphy and handwriting, where letters are usually slanted and sometimes even joined.Possible values:
normal,italic,oblique -
fontVariant The font variant property controls whether the text is rendered in
normal,titling-capsorsmall-capscharacters. Small caps are designed to look similar to the uppercase characters, but in a smaller size and with slightly different proportions. Titling-caps are designed to look similar to the uppercase characters, but in a larger size.Possible values:
normal,small-caps,titling-caps -
fontWeight The font weight property controls the boldness of the font. The font weights available to you will depend on the font-family you are using. When specified via numeric values, the 100-900 range is effectively mapped to the 9-point relative scale where 400 is normal (sometimes referred to as 'book') and 700 is bold (sometimes referred to as 'bold').
Possible values:
normal,bold,bolder,lighter,100,200,300,400,500,600,700,800,900 -
label A text or mathematical label. With a prefix 'latex:' or 'tex:', the rest of the label is interpreted as LaTeX input. With a prefix 'math:', the rest of the label is interpreted as MathLingo input. For latex/tex and math labels, use ASCII only. Otherwise, the text is used directly as a unicode string. LaTeX $ delimiters are NOT supported.
-
lineColor A HEX color or RGB color such as rgb(255,255,255) for the stroke
-
lineStyle Determines the style of the drawn lines for the entity in question. If not specified, the line style is
solid.Possible values:
solid,dashed,dotted -
lineWidth Determines of the drawn lines for the entity in question. If not specified, the line width is
medium.Possible values:
very-thin,thin,medium,thick,very-thick -
nodeShape The shape of the node. If not specified, the shape is
circle.Possible values:
circle,double-circle,square,diamond,triangle,ellipse,rectangle,invisibleDefault value:
circle -
nodeSize Node size relative to a base size; if not specified, the node size is 1
Default value:
1 -
nodeWidthToHeight Width to height ratio of a node; if not specified, the ratio is 1
Default value:
1 -
offset An offset from a position in units relative to the natural size of the node or edge
This applies to label offsets for nodes and edges and weight offsets for edges.
Possible values can be one of:
-
none -
A cardinal direction (one of north, northeast, east, southeast, south, southwest, west, northwest, left, right, up, down, upper-left, upper-right, lower-left, lower-right). This offsets by the node or edge size in that direction.
-
A cardinal direction with a distance in units of the node or edge size.
-
Two cartesian coordinates dx, dy for the offset in units of the node or edge size.
-
Offset specified in polar coordinates, with a number representing an angle in degrees, and another number indicating the (non-negative) distance from the position in units of the node or edge size.
-
-
style Styles are arbitrary names that are associated with the settings of selected style parameters. If set, this is either a single style name or a list of style names whose style parameters will be applied to the entity. If the same style parameter is set in multiple styles, the first style listed takes precedence.
-
textAnchor Where a string's position is anchored
Possible values:
start,middle,end
The GraphMaker Node Library
While the GraphMaker REPL is a convenient medium for interactive graph building, it can be useful to build GraphMaker functionality into other apps or pages. For this purpose, GraphMaker can also be used as a Javascript or Typescript library.
Once you initialize your graph and your ai model, you issue a series of asynchronous updates that return a new graph state and maybe output as well, depending on the specific update provided. Updates include running a task, resetting the graph, and much more. It is relatively straightforward to provide functionality like the REPL in another context this way. (Indeed, the REPL is build just like this.)
Installation
npm install @isle-labs/graphmaker
Usage
const GraphMaker = require( '@isle-labs/graphmaker' );

const state = GraphMaker.initializeGraph( config );

const oracle = GraphMaker.aiFactory( 'openai' );

// Update the graph with a natural language prompt:
const [ newState, output ] = await GraphMaker.updateGraph( state, GraphMaker.task( 'Add a node A', oracle ) );

// Export the graph in various formats:
const [ _, svgOutput ] = await GraphMaker.updateGraph (state, GraphMaker.save({ format: 'svg' }) );
API
.initializeGraph(config)
Initializes a new graph state with the given configuration options.
Arguments
config: configuration options
Returns
The initial graph state
.aiFactory(provider, {type, model, apiKey})
Creates an AI instance for generating directed and undirected graphs that match a specified JSON schema. The AI instance will be responsible for ensuring that nodes, edges, and properties are set correctly according to the schema.
Arguments
provider: the AI provider to use (currently only supports 'openai')options: the options for the AI instanceoptions.type: the type of AI instance to create (supports'streaming'or'single')options.model: the AI model to use (currently only supports'gpt-3.5-turbo'and'gpt-4')options.apiKey: the API key to use for the model provider
Returns
- A function that takes a user prompt and an object containing the current graph state and history, and returns a Promise that resolves to the updated graph state according to the AI's interpretation of the prompt.
.updateGraph(state, {action, payload})
Updates the graph state based on the action and payload. The following actions are available:
'TASK': Change the graph according to a user's prompt'REDO': Redo the last undone command on the graph'UNDO': Undo the last command on the graph'CONVERT': Convert the graph to a given format'SET_GRAPH': Set the graph to a given graph
Arguments
state: the current state of the graphoptions: the options for the updateoptions.action: the action to performoptions.payload: the payload of the action
.task(prompt, oracle)
Returns a command to change a graph according to a user's prompt. The AI model passed as an oracle (e.g., a function returned from aiFactory) will interpret the prompt and perform the desired action, such as adding or removing nodes or edges, or changing properties of the graph elements.
Arguments
prompt: the prompt to update the graph withoracle: the oracle to use for the prompt
.setGraph(graph)
Returns a command to set the graph to a given graph.
Arguments
graph: the graph to set
.resetGraph()
Returns a command to reset the graph to its initial graph.
.redo()
Returns a command to redo the last undone command on the graph.
.undo()
Returns a command to undo the last command on the graph.
.save(config)
Returns a command to save the graph in a given format.
Arguments
config: the graph config payloadconfig.format: the format to save the graph in (defaults to 'json'). Possible values are: 'svg', 'pdf', 'png', 'jpg', 'jpeg', 'gif', 'webp', 'tiff', 'tikz', and 'json'.config.draft: whether to save the graph as a draft (defaults to false)
TypeScript Definitions
While the library is written in JavaScript, it includes TypeScript definitions for use in TypeScript projects.
See the auto-generated TypeScript documentation for more details.